NetSpyglass Case Study

Time, for a new approach

Overview

After our success at Netcitadel, I was asked by the founder of that company to work with him on a new startup to create a next generation network configuration and monitoring tool. We began to think about what problems we wanted to address and how we might disrupt the market segment that current tools targeted. We knew from our previous research and design that pure network configuration tends not to be something that companies want to pay large amounts of money for (even if our solution was platform agnostic) since there's already a glut of tools for those tasks.

Which Problem?

As anyone telling who works in a NOC or security ops center will tell you, there is no shortage of problems that could use better solutions, especially given that network applications don't get the attention that consumer applications do and tend to evolve more slowly.

It was around this time that the answer presented itself from a most unexpected source.

The Problem

Not long after my initial discussions about what the focus of our new application should be, I was chatting with my wife in our kitchen. At the time she was a senior director in IT at Juniper Networks managing end to end applications. She was telling me about a typical problem she was having after an application outage that affected her team.

She explained that her headache was due to the fact that an application was briefly unavailable during the night and when the team went to diagnose the issue the application team was blaming a network related issue, and the network ops team was blaming the application team.

I replied that it sounded quite painful, and she said, "Oh, it happens all the time. And by the time someone get's to look at it, it's back up and there are only logs and various other report systems that have to be combed through and correlated by the root cause analysis folks."

And then she followed with a sentence that hit me like a bolt of lightning, "I just wish there were a way to see the state of the network at an application level and at a network level at the moment the application went down."

Roles & Solutioning

I was the only designer on the project, while my partner from Netcitadel was architecting and implementing the backend using Hadoop to support the massive amount of data that we'd be needing to store to be able to support the proposed functionality. We also had two front end developers in Ukraine who would be implementing my designs.

It was also my responsibility to validate designs with users, quickly summarize tests, and adjust designs to include feedback. I also worked with the front end team to deliver graphical assets and made sure that the implementation reflected the design accurately.

It didn't take long to identify a few requirements that we knew we wanted:

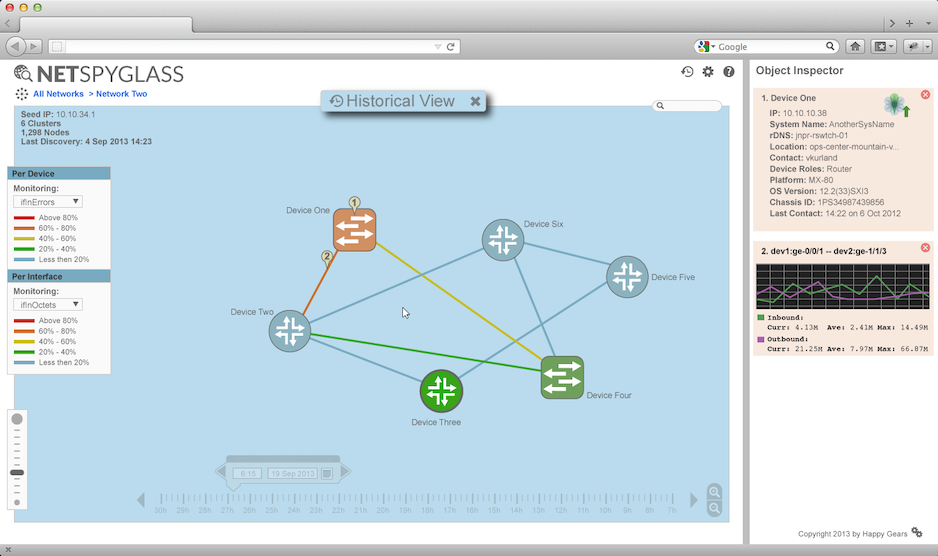
The application should provide a way for users to look back in time at a changing networks state to identify why systems are broken. This time machine functionality had to simple to use and look very much like the "current" network state screens to avoid confusion.

The app must be completely reliable with no "gaps" in the data. If our app showed the state of a network it had to do so accurately to gain the trust of users.

While the map would be pretty standard across networking tools, the user needed to be able to quickly drill down to get additional information once the source of the problem was identified.

Process & Approach

As I've mentioned in other case studies, the single most important part of design is to ensure you understand the user as completely as possible. Unlike the Threat Response application, users of Netspyglass usually fall into one of three major roles:

The first are network application teams. This group of users are interested in the the performance of different parts of the application, for example a database. They're concerned with the connectivity between the application elements and expect the network to simply be available and to perform well even under high loads.

The second user group were highly expert network operators. These users are quite comfortable using the CLI, and are happy to see massive amounts of information on screen at once. For them, hiding information is a pain point.

The third group of typical users are trying to do root cause analysis to determine why certain issues have occurred. Since they're technical expertise falls over a range of backgrounds from highly technical to development managers we decided that we'd need to have "quick diagnose" functionality which would allow them to know what teams are needed to address problems as they come up. We felt pretty certain that our proposed time machine functionality would serve this purpose well.

Validating Our Assumptions

In order to validate our ideas we leveraged our combined network of both application support engineers and network operations team members. We drew a number of conceptual sketches, took several folks to lunch or coffee and discussed our ideas to get a sense of whether we were even on the right track to developing a useful tool.

As much as I'd like to say that everything that I'd assumed was correct, in truth we'd over simplified the roles and role overlap. In particular, in smaller enterprises the applications support teams were sometimes the network ops teams as well. Coupled with the fact that larger enterprises may have several solutions in place to address facets of what we were attempting, and due to the fact that penetration of these companies often takes longer than smaller enterprises, we made the conscious decision to rework the designs with an emphasis on simplifying the initial topology view, but adding specialized drill downs for analyzing root cause. We added faceted search capabilities, an object inspector that allowed a configurable, and stackable quick look at different metrics for selected devices that allowed users to avoid leaving the device map.

Where We Landed

Our proposed time machine functionality was the one aspect of our original proposed design that remained almost exactly as we'd assumed it should. Feedback from both the network ops folks and the application team members was that the ability to drill in directly from the topology map whether it be in real time or time machine mode was critical, and both sets of people didn't want to navigate away from the map itself because if they had drilled into a false positive they didn't want to have to navigate back. Also, robust filtering was desired by the application teams especially in time machine mode. This approach was appealing to us since application team managers could use the topology views to determine what systems contributed to issues without necessarily getting into the weeds as well.

Outcomes

When the first version of Netspyglass launched it took some time and leg work on our part for it to be adopted. In particular it required sitting in a NOC at Dropbox headquarters in San Francisco with operators, installing an instance and allowing it to discover their network and then demonstrating the ease with which issues can be identified and analyzed. Once they saw what the tool could do they agreed to a formal POC in their NOC that resulted in them becoming our first real customer. Not long after, deals were signed with The Gap, and several other smaller enterprises.

An Interesting Conversation

Sometime after being adopted by Dropbox my wife and I were preparing to rent out a condo that we have in Mountain View, and I was asking the new renters what they did for a living. He replied that he worked at Dropbox in the operations center. When I asked what he did, he said he wasn't sure how to explain it without knowing what my background was. I told him I'd worked at Juniper Networks, and several other networking startups, and hearing this he simply said he monitored network issues and kept things running smoothly.

Realizing he may have heard of the product, I told him that I'd designed a tool they used at Dropbox called Netspyglass and he replied excitedly that, "NSG is my go to tool at work! I love that application!"

Of all the ad hoc feedback I have received in my career, this remains one the things I'm most proud of hearing about something I designed.

Learnings

This project offered several key learnings. First, that although the tenant that you have to know your user is very true, it's also important to understand the overlap of different types of users. In retrospect it seems obvious, but we were so focused on building the right tool for each that we missed the other truth; users may need very similar tools even if their roles are not identical. If we'd gone through a more formal and traditional requirement gathering phase we may have been noticed this sooner.

Another interesting thing that we discovered was that the old Apple saw, "Think Different" could easily be applied to almost any problem. For us, this meant that if when we were trying to identify our applications value proposition, we may have been better off to simply ask various sets of users (like my wife), "What is the problem and if you could have any magical solution what would that do for you?"

My wife insists that there is a third key learning: listen to your wife. While I do think she has a point, she'd be the first to tell you that I've not fully integrated this one into my approach to life.
Screenshots and Drawings

A few images from the journey.

© Matt Welsh 2019